Usage
In this area you can find useful metrics about how your asset groups are used. It is only visible if you've subscribed the Storage add-on.
You start by expanding the Content Management menu item, then the Asset Groups menu item and finally click in Usage:

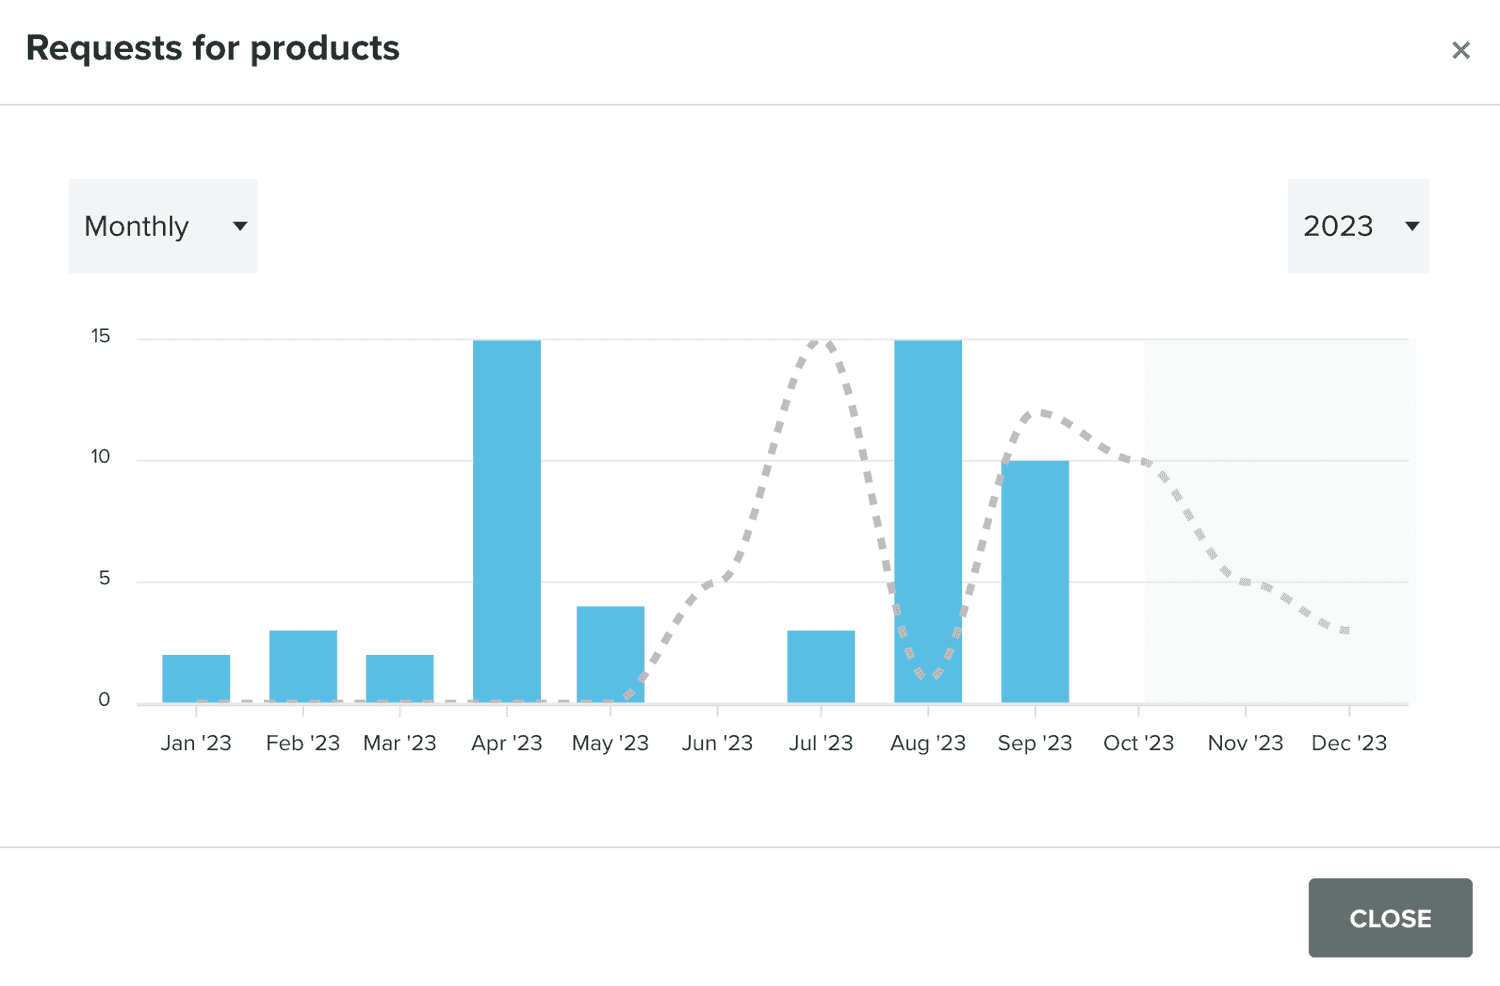
In this area you will find a chart with the total number of times asset groups were requested over time and the total number of asset groups requests to date:

You will also find a list with all your active asset groups and its total number of requests to date:

Clicking in each entry on this list will open a window as follows:

Where you can see a chart with the total scans for specific tags.