Usage
In this area you'll find all the your key metrics about the usage of your asset groups.
To access this area, expand the Storage menu and click in Usage:

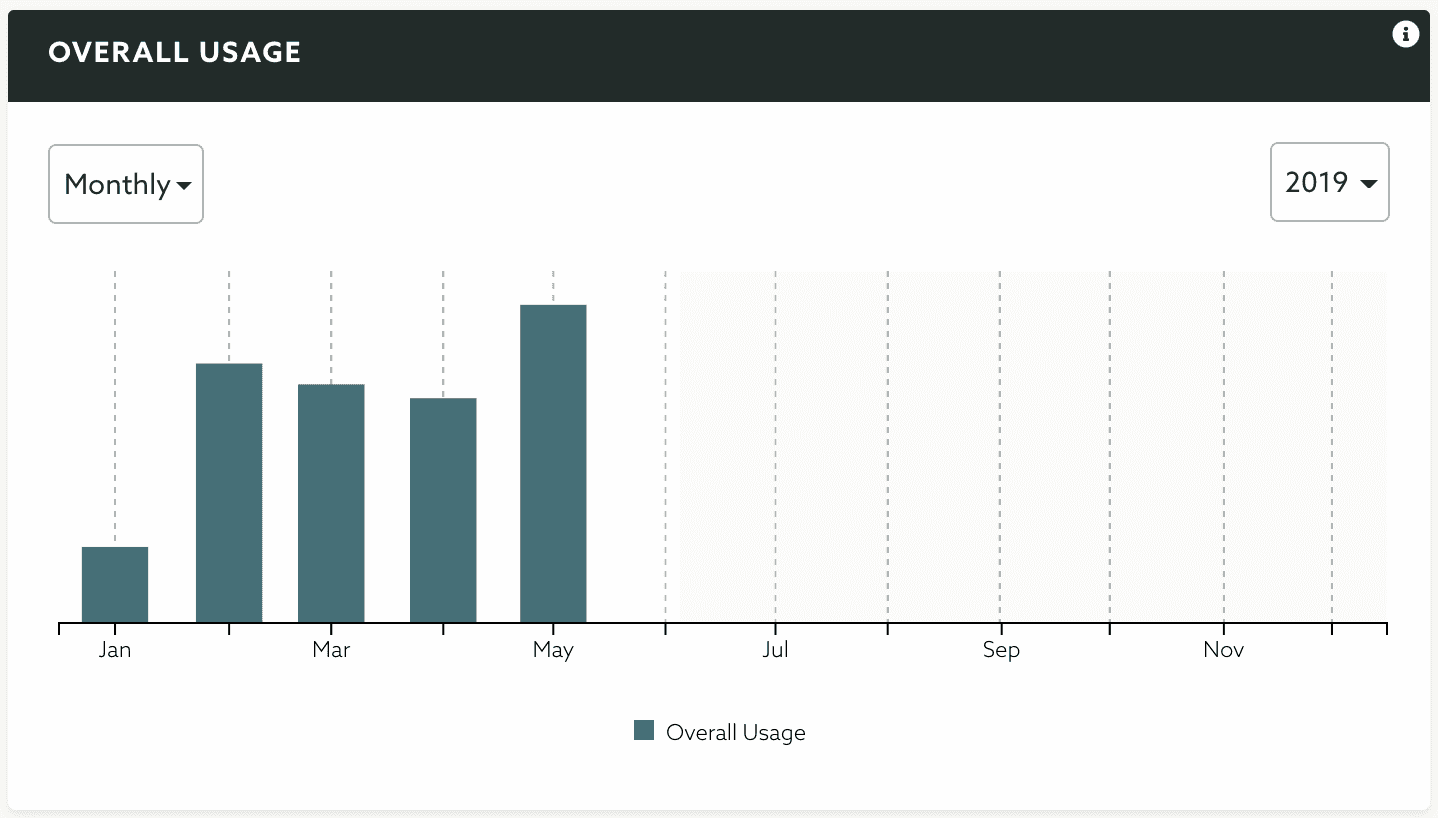
In this page you'll see the time series breakdown chart containing the total usage of your asset groups:

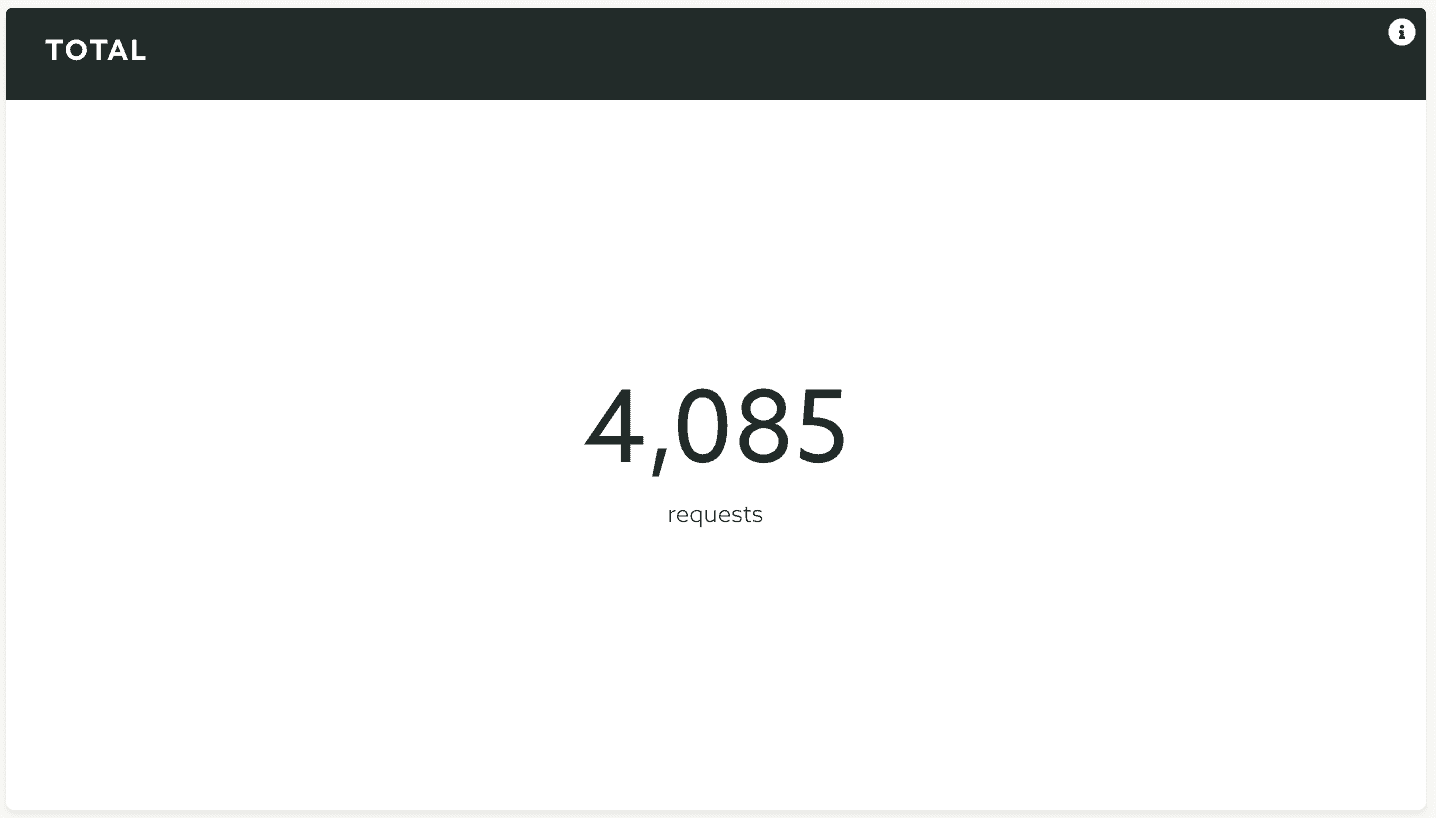
You'll also find the total number of asset groups served to date:

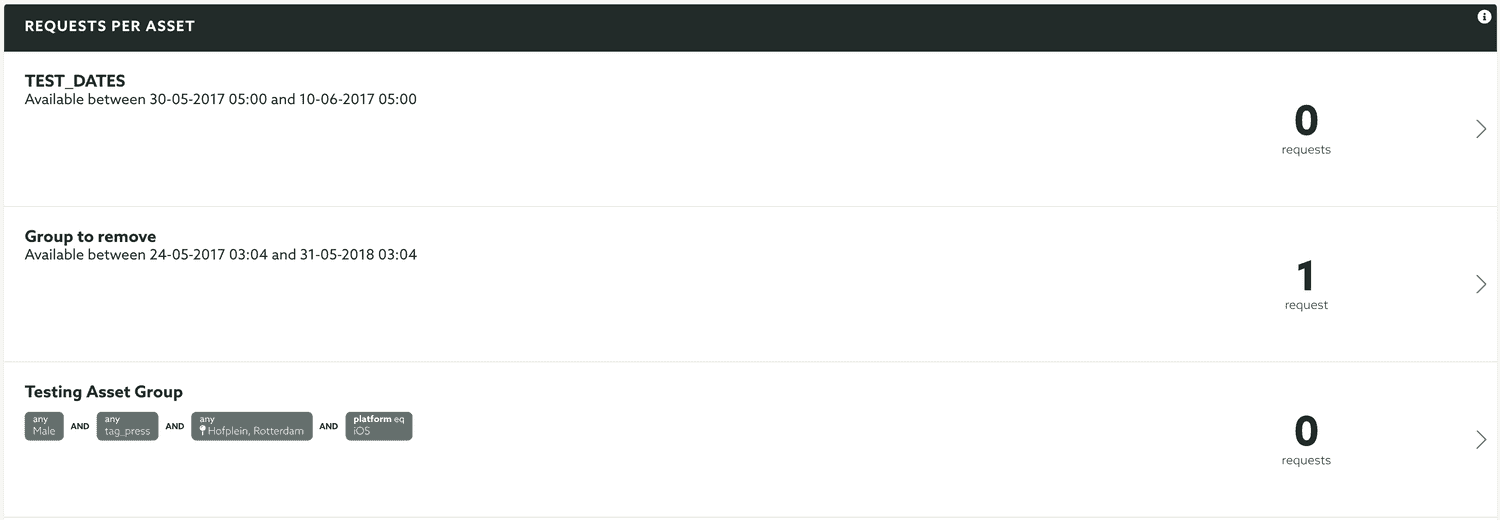
You will also find a time series breakdown per asset group:

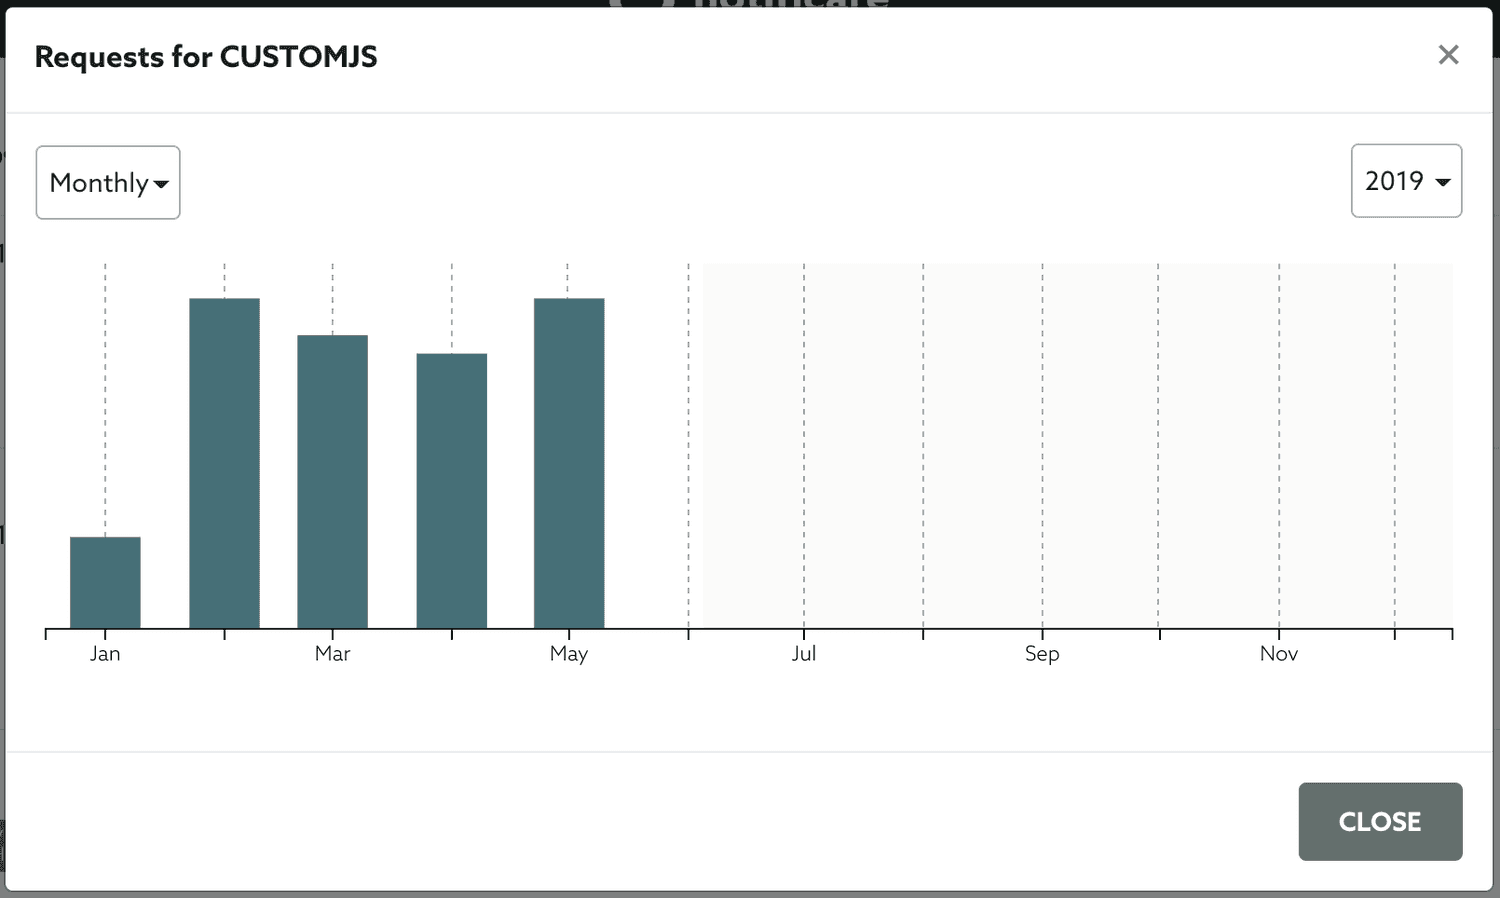
Finally, if you click in any of the asset groups in the previous list, you will see a breakdown overtime of all the requests made for that group as shown below:
