Locations Overview
In this area you will be able to find the most important stats about your location data.
To access this area, expand the Locations menu and click in Overview:

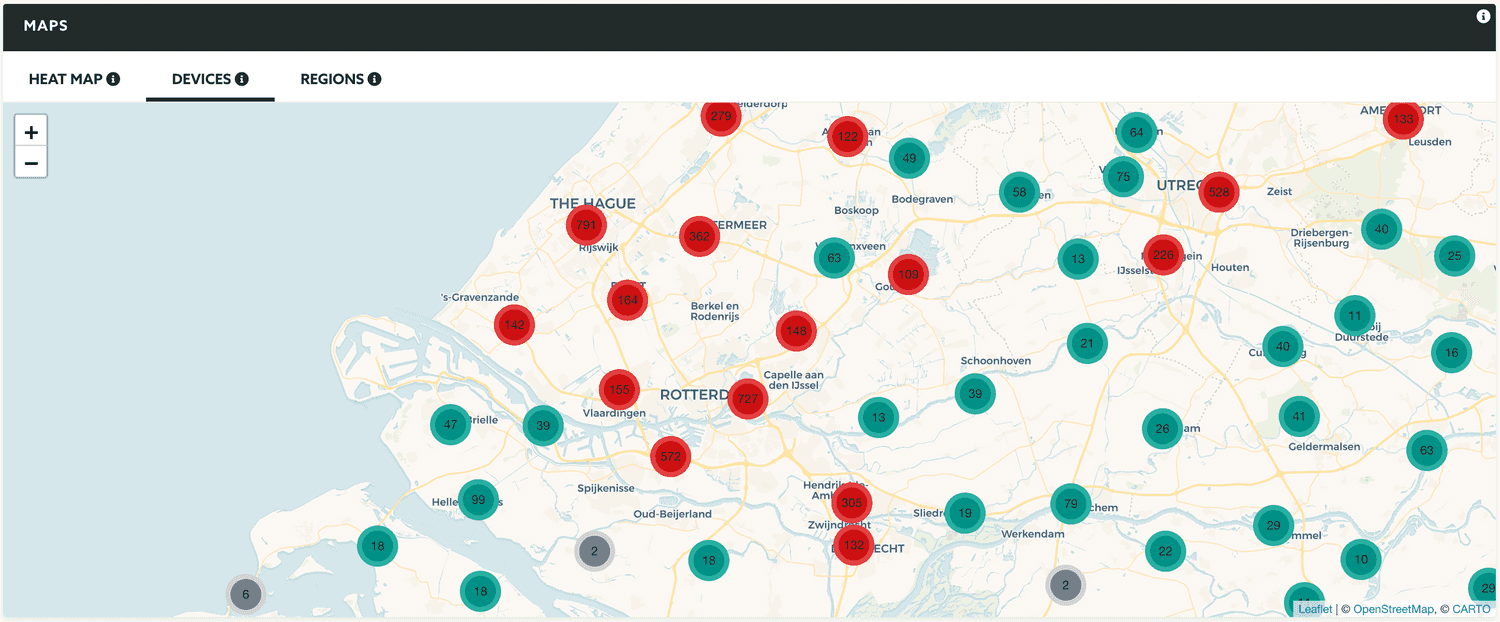
You can visualize all your audience density by clicking in the Heat Map tab:

Click in the Devices tab to get a quick glance where your users are:

Click in the Regions tab to get a quick glance to all your geo-zones:

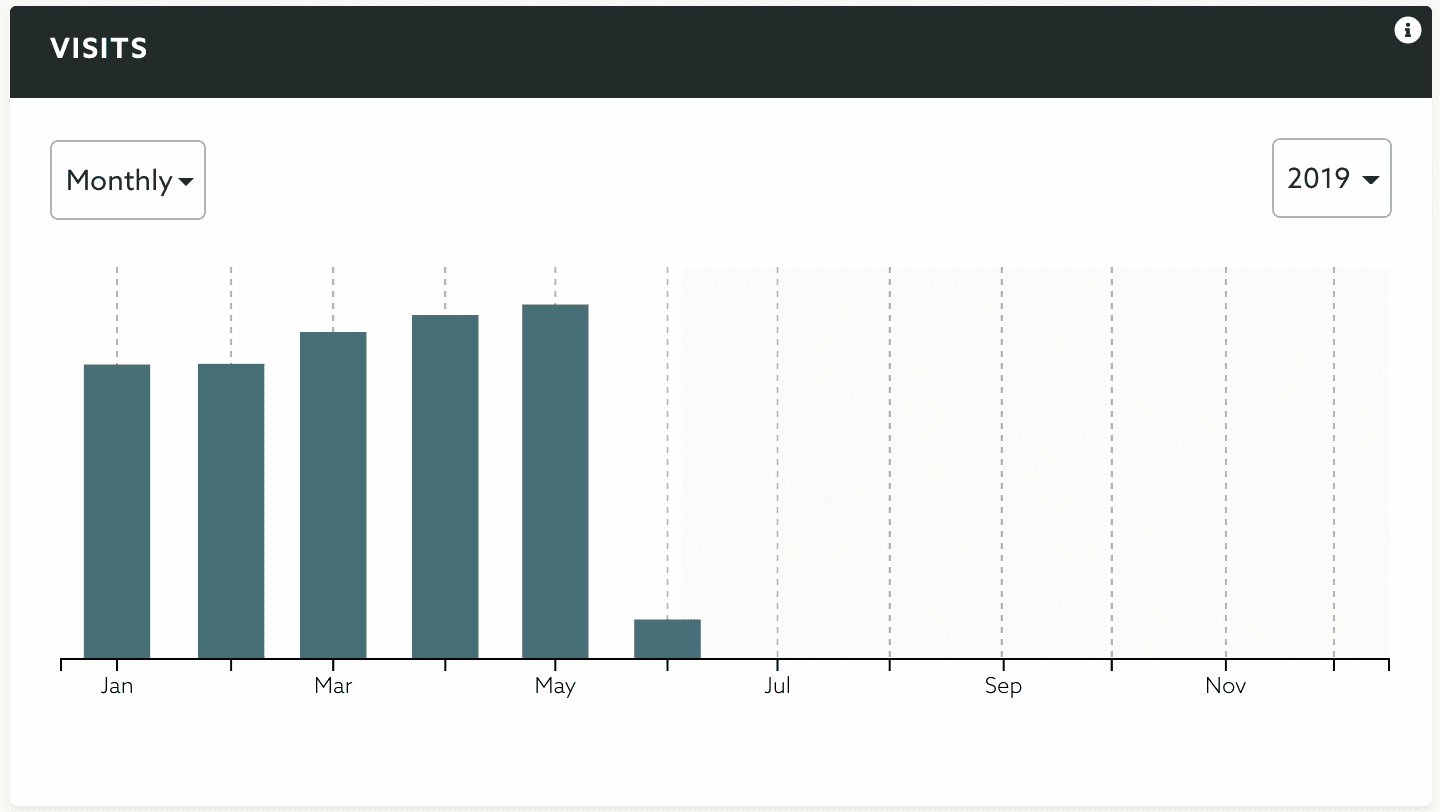
You can also see all the visits to your geo-zones plotted in a time series chart:

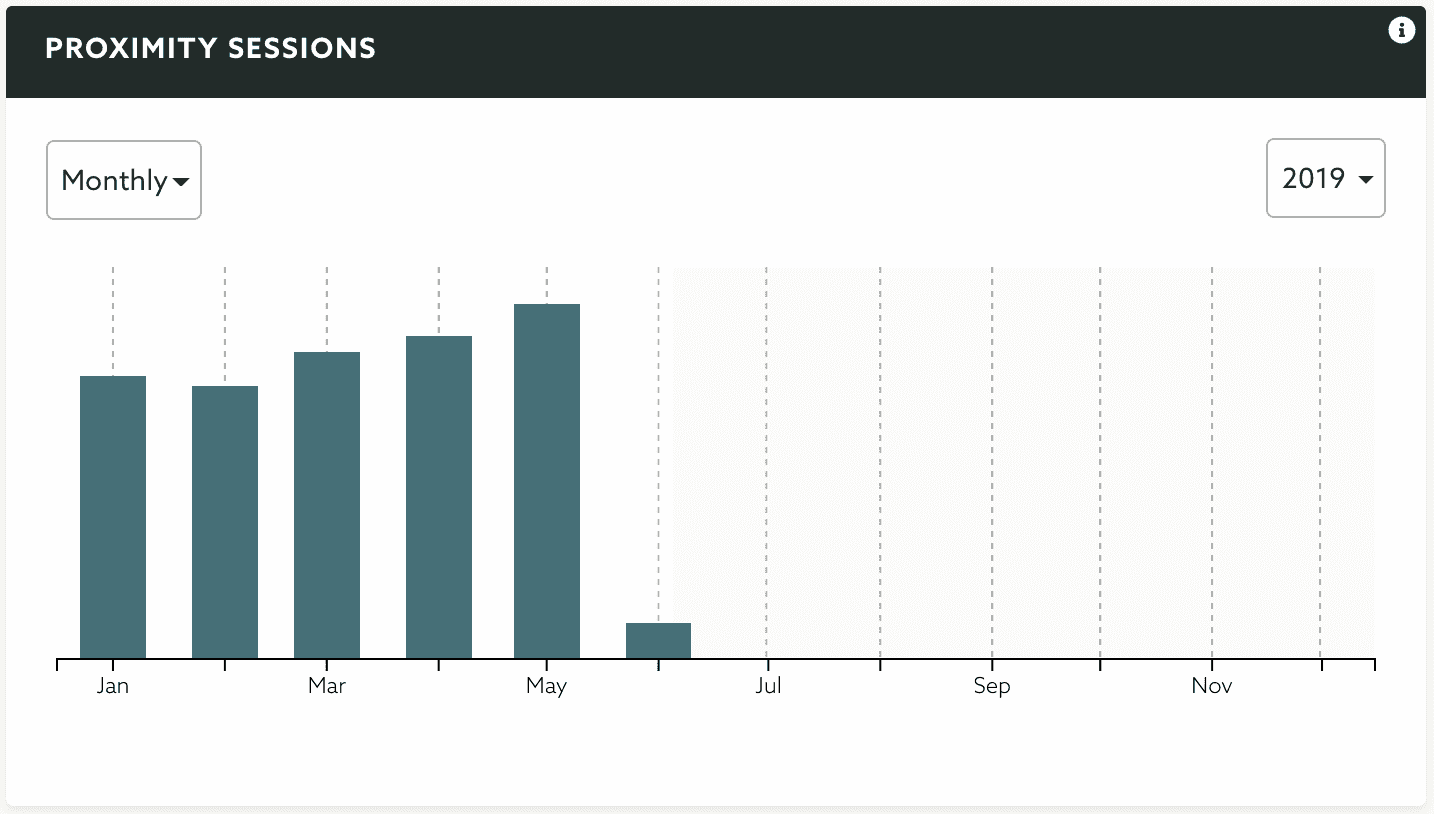
You can also see all the proximity sessions of your beacons plotted in a time series chart:

You can also quickly see the top visited regions:

Finally you can also see which regions currently have most visitors:
