Campaign Stats
In this area you will learn how to interpret the results of a campaign.
If you are looking to get the stats for an active campaign, from your app's menu expand the menu item Campaigns and click in Campaigns:

Then go ahead and click in the campaign you wish to see the results from:

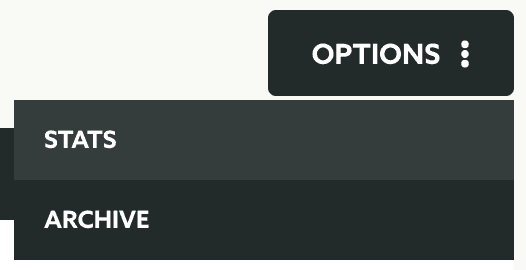
Finally expand the Options menu and click in the Stats option:
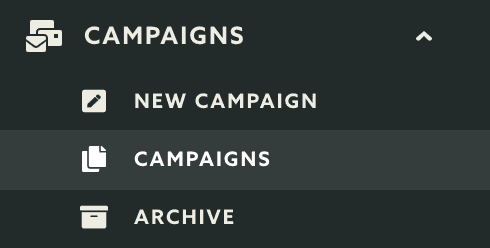
If instead you are looking for results for an archived campaign, from your app's menu expand the menu item Campaigns and click in Archive:
Then simply click in the campaign you wish to see results from:

Depending on your time of campaigns, your stats will look a bit different. Please keep reading to understand the results of all teh available campaign types.
Simple Push Campaign
For this type of campaigns we will round up the amount of messages sent, failed, opened and replied. In the first chart you will find the conversion of your campaign:

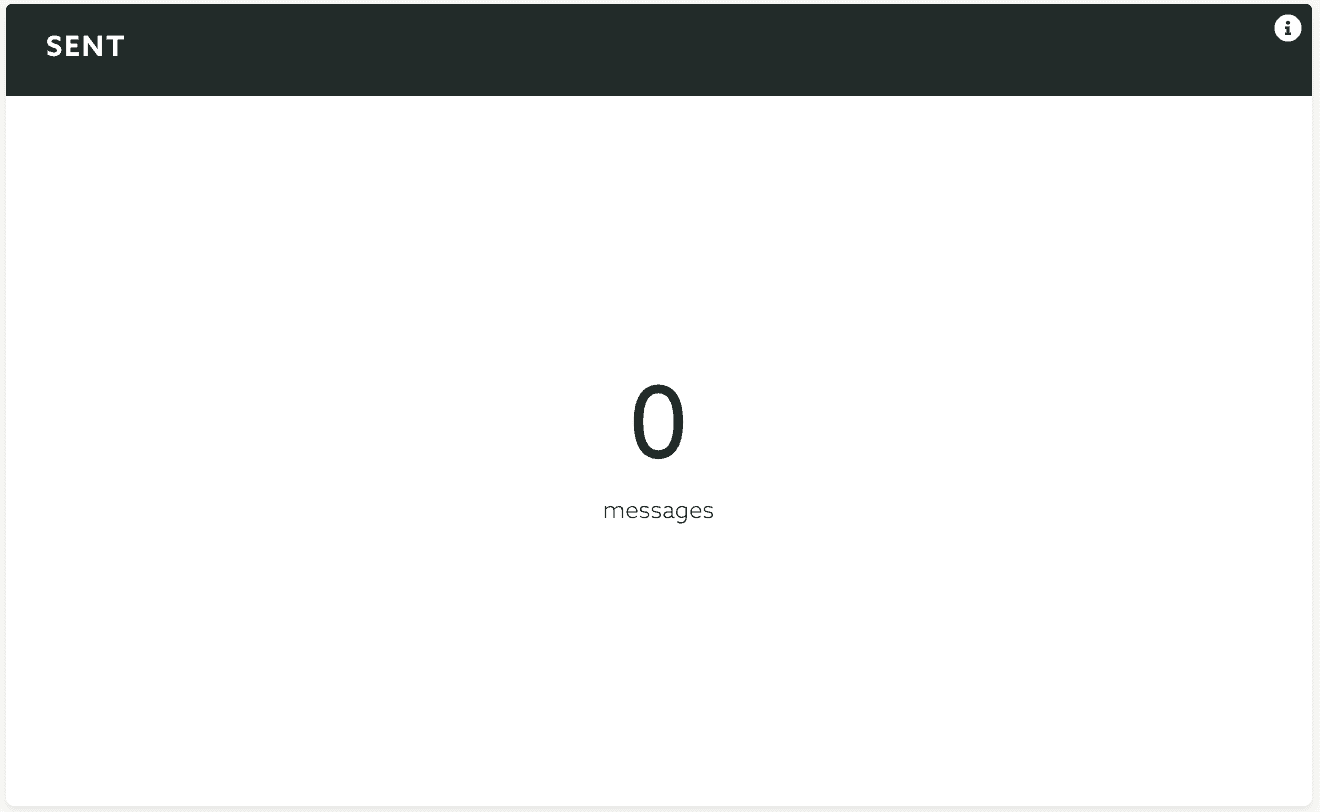
You will see the total number of sent messages:
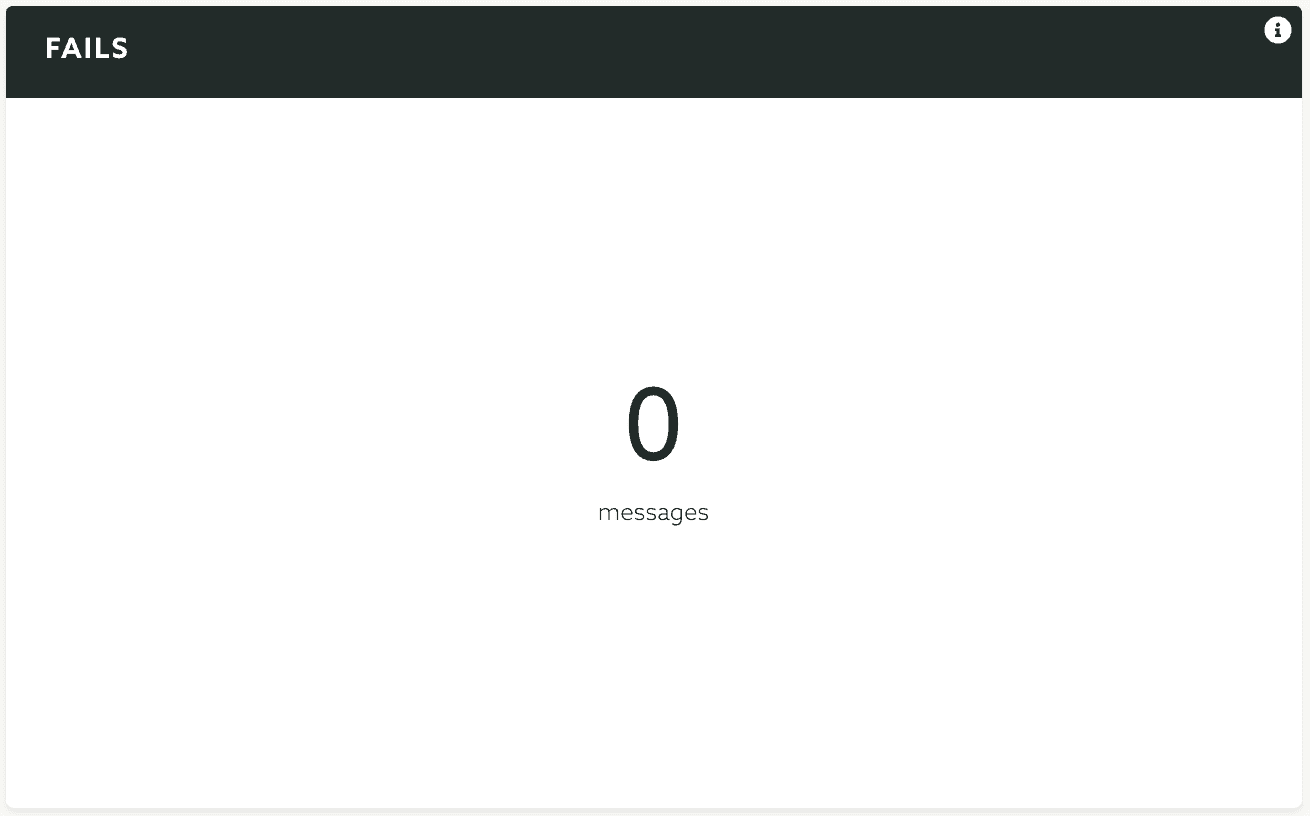
And the total number of failed messages:
You will also see the comparision between messages opened and uniquely opened:

If your messages have actions, you will also see the distribution of all the responses in this pie chart:
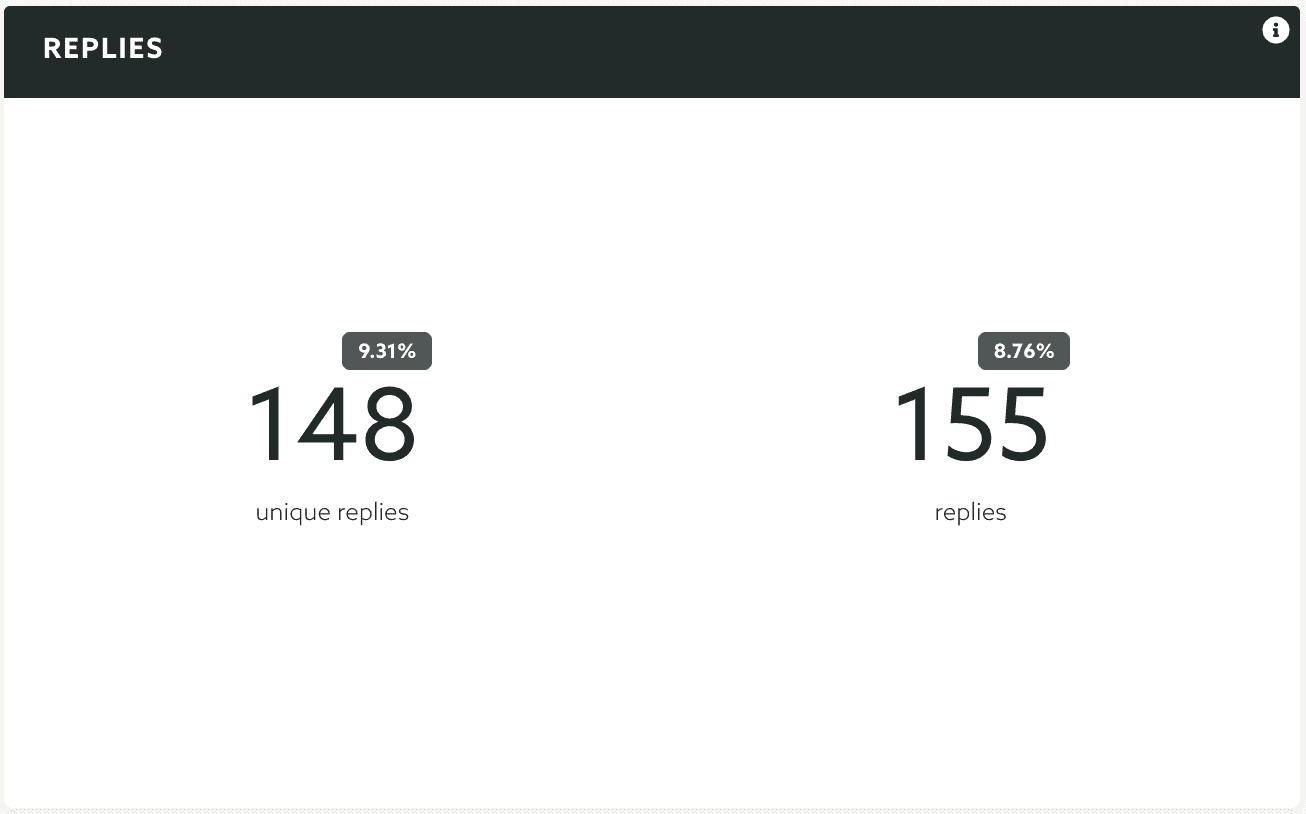
And the total amount of replies and unique replies:
Simple Email Campaign
For this type of campaigns we will round up the amount of messages sent, failed and opened. In the first chart you will find the conversion of your campaign:

You will see the total number of sent messages:

And the total number of failed messages:

You will also see the comparision between messages opened and uniquely opened:

Simple SMS Campaign
For this type of campaigns we will round up the amount of messages sent and failed. Due to its nature no other stats will be collected.
You will see the total number of sent messages:

And the total number of failed messages:

For Simple Push Campaigns, Simple Email Campaigns and Simple SMS Campaigns you can also export all the events related to every individual message in a campaign. This is done via the Options menu by clicking in Export Events:
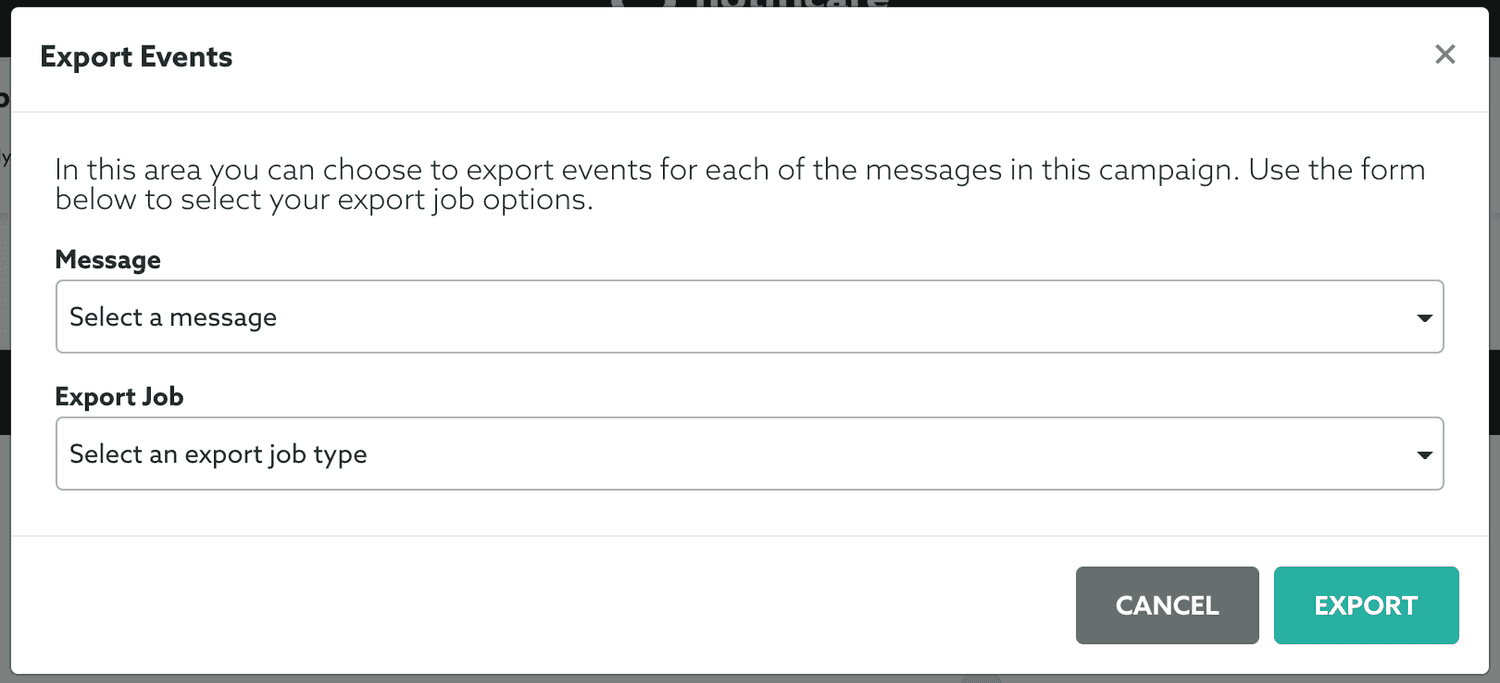
This will open a window where like the one below:

Then you can select which message you want to export events from:

And which events you want to export:

Finally just click in the Export button to start an export job:

Location Based Campaign
For this type of campaigns we will round up the amount of messsages triggered, failed, opened and replied to. In the first chart you will find the conversion of your campaign:

This will give you a pretty clear view of how many messages were triggered, opened or uniquely opened.
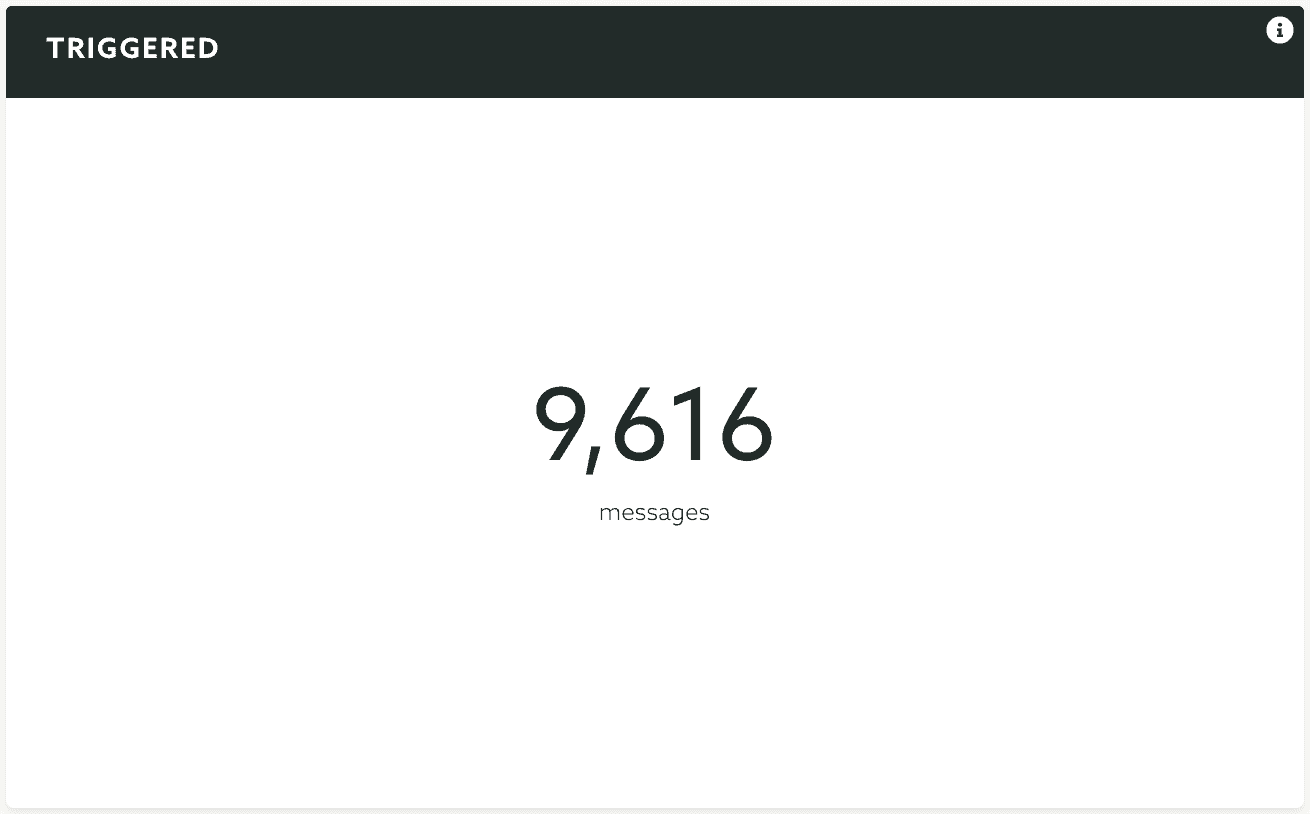
You will also see the total number of triggered messages:
Or the number of failed messages:

You will also see the comparision between messages opened and uniquely opened:

If your messages have actions, you will also see the distribution of all the responses in this pie chart:

And the total amount of replies and unique replies:

Finally, in this page, for Location Based Campaigns, you can also export all these results as a CSV file. To do that, expand the Options menu and click in Export:

A/B & Multivariate Testing
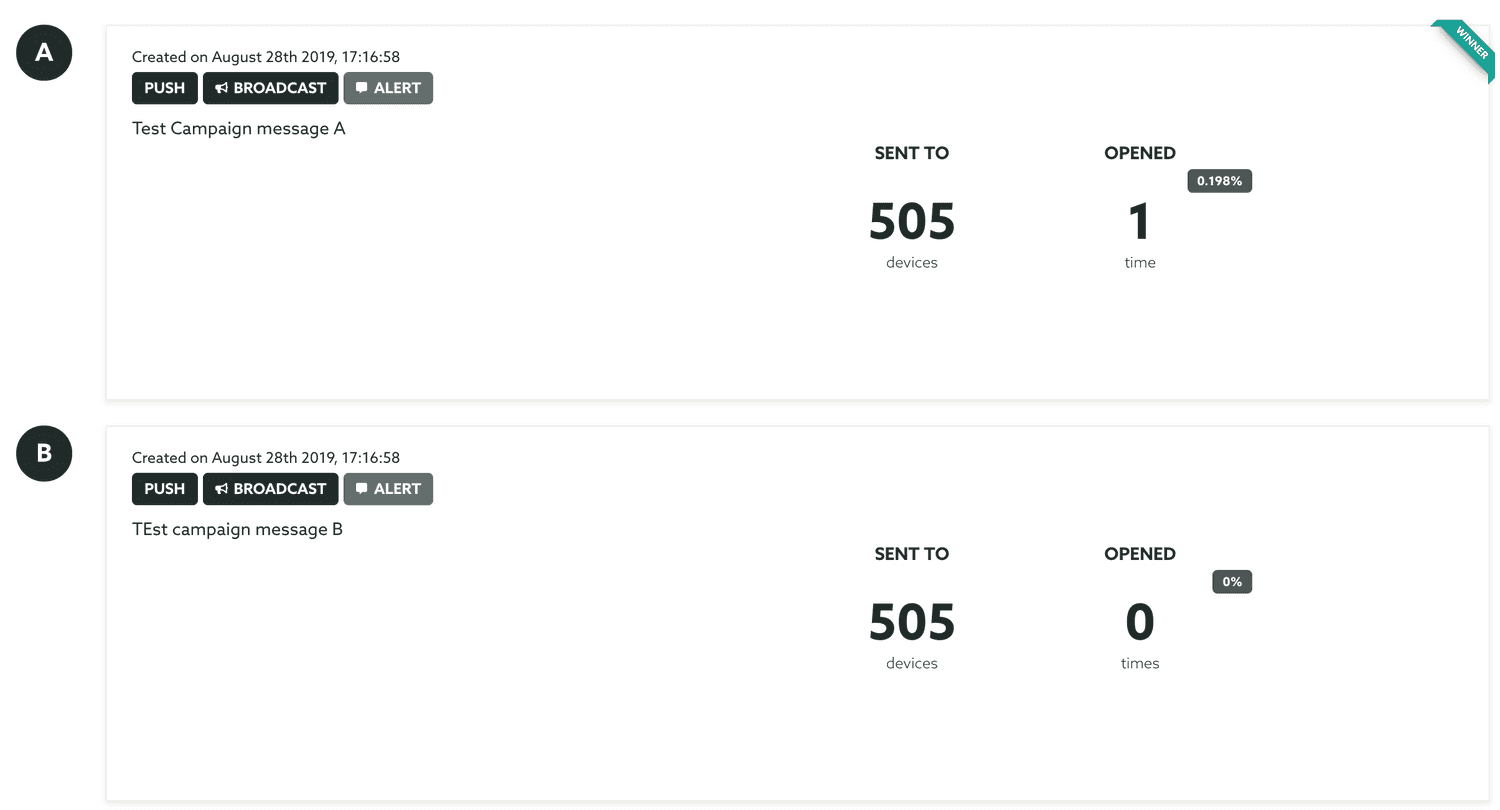
We will only round up the result of your tests for campaigns with type Winner. For this type of A/B & Multivariate Testing campaigns, we will display the results of your test prior to sending to the winning content:
For this type of campaign, you can also export all the events related to each individual message. This is done via the Options menu by clicking in Export Events:
